K1092: Asset-Matched DCC-A4f (SPY-VIX + GLD-GVZ) — Pareto-Dominant 但 Below Harvey 的 Portfolio VaR Refinement
讀者互動
已追蹤瀏覽 0 次,登入會員可按讚與收藏。
摘要
本研究在 K1041 建立的 DCC-A4f 雙變量 GARCH-X 架構上,檢驗一個看似簡單但具理論意義的 refinement:當投資組合由 SPY(股票)與 GLD(黃金)50/50 配置時,GLD 的 marginal volatility regressor 應該沿用 equity-centric 的 VIX²(SYMMETRIC 版,K1041 原設定),還是改用 asset-matched 的 GVZ²(CBOE Gold VIX)?
結果呈現一個 Pareto-dominant but below Harvey 的精密型態:DCC-A4f-ASYM(SPY-VIX² + GLD-GVZ²)在 QLIKE、FZ(α=1%)、FZ(α=2.5%) 三個指標全部優於 DCC-A4f-SYMM(K1041 baseline),且每個 DM 檢定 p-value 都小於 0.05;但三個 DM t-statistic(2.95 / 2.95 / 2.14) 全數落在 Harvey (2016) |t|>3.0 門檻之下 。樣本為 2013-06-01 → 2026-04-12 OOS 共 3,234 個交易日。
此結果示範了 Harvey threshold 作為 multiple-testing-safe significance boundary 的 實戰意義 :相對於 DCC-GJR 這類明顯弱的 baseline,DCC-A4f-ASYM 的 DM t 分別達到 5.06 / 4.97 / 3.84(三項 Harvey PASS);但相對於 DCC-A4f-SYMM 這個已經相當強的對手,incremental improvement 雖然 direction-consistent 且 Pareto-dominant,卻不足以跨越 Harvey 門檻。我們建議將此類結果定位為「consistent supportive evidence」而非「standalone strong finding」,等待跨多組 asset-pair 的 meta-analysis 累積證據後方能獨立承擔 universal claim。
研究背景
K1041 的起點
K1041 建立了一個 strong claim:對 50/50 SPY+GLD portfolio 的 Value-at-Risk,DCC-A4f 模型(Engle, Ghysels & Sohn 2013, RES 95(3) 提出的 multiplicative GARCH-X)顯著優於 DCC-GJR baseline。DM t=+3.826(Harvey PASS),Trinity 2/2,portfolio QLIKE 從 -8.836 改善至最優 rank 1/4。這個結果推翻了早前 K891 對 multi-asset VaR 中 DCC 相關性角色的 NULL result: 提升不是來自 DCC 本身,而是來自 A4f 帶入的 macro-implied volatility channel (VIX²)。
然而 K1041 有一個未處理的架構選擇: 兩個 marginals 都用 VIX² 。這是 equity-centric 的設定。對 SPY 合理(VIX 本就衍生自 SPX 選擇權),但對 GLD 就變成「用股市的 implied volatility 當黃金的 regressor」。
K1085 / K1088 / K1091 的補充證據
隨後在 univariate 層級的檢定(K1085、K1088、K1091)揭示一個 universal pattern:
- K1085 (GLD) : A4f-GVZ 相對 A4f-VIX,univariate QLIKE DM t=+4.46(Harvey PASS,n=4,848)
- K1088 (USO) : A4f-OVX(Oil VIX)相對 A4f-VIX,DM t=+4.48(Harvey PASS)
- K1091 : 跨 equity / commodity / gold / bond 的 meta-validation,確認 asset-matched implied volatility 是個通則
這些結果在 univariate 層級是 clear-cut 的 Harvey PASS。 但是 univariate 層級的 4.46 / 4.48 t-stat,會如何在 portfolio 層級被稀釋? 這就是 K1092 的核心研究問題。
差異化
- K1041 的 claim 是 A4f 勝 GJR,於本研究為 baseline validation(已知結果)
- K1085 / K1088 / K1091 的 claim 是 asset-matched IV 在 univariate 有效(已知結果)
- K1092 的新 claim :當 univariate asset-matched IV 被裝進 bivariate DCC-A4f 並投射到 50/50 portfolio variance 上,edge 會被 稀釋到什麼程度?Harvey threshold 會不會被保住?答案是 Pareto-dominant 保留 + Harvey 失守 。
方法與數據
| 項目 | 設定 |
|---|---|
| 資產 | SPY(S&P 500 ETF)+ GLD(Gold ETF)50/50 portfolio |
| Implied vol 指數 | ^VIX(SPY 用)、^GVZ(CBOE Gold VIX,GLD 用) |
| 資料來源 | yfinance(SPY, GLD, ^VIX, ^GVZ 日收盤) |
| 全期 | 2005-01-04 → 2026-04-12(5,350 天) |
| OOS 期 | 2013-06-01 → 2026-04-12( n = 3,234 days ) |
| Rolling window | 1,250 business days(約 5 年) |
| Refit frequency | 每 63 個交易日 refit 一次 |
| Seed | 42(所有 MLE starting values grid-search 固定) |
三個競爭模型 (全部使用 DCC(1,1) 作為第二階段相關性動態):
| Model | SPY marginal | GLD marginal |
|---|---|---|
| DCC-GJR | GJR-GARCH(1,1) | GJR-GARCH(1,1) |
| DCC-A4f-SYMM | A4f: τ = θ₀ + θ₁·VIX²_{t-1} | A4f: τ = θ₀ + θ₁· VIX² _{t-1} |
| DCC-A4f-ASYM | A4f: τ = θ₀ + θ₁·VIX²_{t-1} | A4f: τ = θ₀ + θ₁· GVZ² _{t-1} |
A4f 多項式:h_t = τ_t · g_t,g_t 跑在 standardized residuals u_t = r_t/√τ_t 上。所有 regressors 嚴格 lag 一天(VIX²_{t-1} / GVZ²_{t-1}),無 lookahead。
Portfolio variance :σ²_port = 0.25·h_SPY + 0.25·h_GLD + 0.5·ρ_t·√(h_SPY · h_GLD)
VaR/ES 方法 :CF-Rolling(K1036 最優 univariate method),252-day window of portfolio standardized residuals → Cornish-Fisher quantile applied to current portfolio σ;α ∈ {1%, 2.5%};ES = empirical mean of residuals below CF quantile × σ。
評估套件 :
- VaR Trinity :Kupiec (unconditional)、Christoffersen (conditional)、Basel traffic light
- ES backtest :Acerbi-Szekely Z₁
- Joint VaR-ES :Fissler-Ziegel (2016) 嚴格一致 FZ0 score(Patton, Ziegel & Chen 2019 form)
- Portfolio variance DM :Diebold-Mariano on QLIKE(σ²_port, r²_port),Newey-West HAC variance(HLN adjustment)
- Harvey (2016) threshold :|t| > 3.0 for multiple-testing-safe significance
核心發現
發現一:ASYM 對 GJR baseline — Harvey PASS on every metric
作為 sanity check,DCC-A4f-ASYM 對 DCC-GJR 的 DM test 必須通過 Harvey 門檻(因為 K1041 已經證實 A4f 勝 GJR,換 regressor 不該改變此結論):
| 指標 | DM t-stat | p-value | Mean loss diff | Verdict |
|---|---|---|---|---|
| Portfolio QLIKE | +5.055 | 4.29e-07 | 0.0612 | Harvey PASS ✓ |
| FZ Score α=1% | +4.969 | 6.73e-07 | 0.1583 | Harvey PASS ✓ |
| FZ Score α=2.5% | +3.840 | 1.23e-04 | 0.0797 | Harvey PASS ✓ |
數據來源:experiments/k1092/k1092_results.json .dm_qlike.DCC-GJR_vs_DCC-A4f-ASYM 與 .dm_fz.alpha_0.010 / .alpha_0.025
解讀:asset-matched 的 DCC-A4f-ASYM 相對「完全沒用 implied vol」的 DCC-GJR 具 壓倒性優勢 。所有三個 t-stat 都 > 3.84,是研究上可以獨立成立的 strong claim。這部份沒有爭議。
發現二:ASYM 對 SYMM — Pareto-dominant but below Harvey
這是本研究的核心結果,也是方法論 case study 的重點:
| 指標 | Mean (SYMM) | Mean (ASYM) | ΔLoss | DM t | p-value | Harvey |
|---|---|---|---|---|---|---|
| Portfolio QLIKE | -9.0928 | -9.1160 | 0.0232 | 2.951 | 0.003 | ✗ (below) |
| FZ Score α=1% | -5.4567 | -5.5303 | 0.0736 | 2.947 | 0.003 | ✗ (below) |
| FZ Score α=2.5% | -5.5882 | -5.6168 | 0.0287 | 2.144 | 0.032 | ✗ (below) |
數據來源:experiments/k1092/k1092_results.json .mean_qlike、.models.*.fz_score、.dm_qlike.DCC-A4f-SYMM_vs_DCC-A4f-ASYM、.dm_fz.*.DCC-A4f-SYMM_vs_DCC-A4f-ASYM
三個觀察:
- 嚴格 Pareto-dominant :ASYM 在三個指標上都有 lower loss(QLIKE / FZ 都是 lower = better;QLIKE 以 negative 表達,所以 -9.1160 < -9.0928)。沒有任何指標顯示 SYMM 勝出或打平。
- All p < 0.05 :三個 DM test 都在傳統 5% 水準拒絕 H0:SYMM = ASYM。如果只看 p-value,這是 three-for-three significant。
- All |t| < 3.0 :但三個 t-statistic(2.95 / 2.95 / 2.14)全部落在 Harvey (2016) 建議的 multiple-testing-safe threshold 之下。QLIKE 與 FZ α=1% 僅差 0.05,FZ α=2.5% 則離得較遠。
發現三:Harvey threshold 的實戰意義
為什麼不直接相信 p < 0.05?Harvey, Liu & Zhu (2016, RFS) 指出:資產定價與計量文獻累積大量 "discoveries" 在 p < 0.05 水準,但考量 multiple testing (每一篇論文都在測自己最喜歡的 spec)後,應把顯著性門檻上調至約 |t| > 3.0(約 p = 0.0027)才能守住 false discovery rate。Harvey (2017, JF) AFA 主席演講更進一步呼籲 Bayesian shrinkage。
在本研究的語境中,three-metric 同時檢定本身就是 multiple testing problem,且歷來研究社群對「A 勝 B」的宣稱有 publication bias 的疑慮。Harvey 門檻提供一個保守但穩健的 benchmark:
- |t| > 3 :可以獨立 publish 的 strong claim
- 1.96 < |t| < 3 :supportive evidence,需要 external replication 或 meta-analysis 佐證
- |t| < 1.96 :不拒絕 H0
K1092 的 ASYM-vs-SYMM 結果完全落在中段。這不是「fail to reject」,而是 "consistent but not standalone-publishable" 。
發現四:VaR Trinity 的質性支持
即便 DM 檢定 below Harvey,VaR-level 的 backtest 也呈現 ASYM 有更好的 violation clustering 表現:
| α | Model | Kupiec p | CC p | Basel | ES p | Trinity |
|---|---|---|---|---|---|---|
| 2.5% | DCC-GJR | 0.59 | 0.11 | Green | 0.97 | PASS |
| 2.5% | DCC-A4f-SYMM | 0.76 | 0.13 | Green | 0.99 | PASS |
| 2.5% | DCC-A4f-ASYM | 0.86 | 0.40 | Green | 0.99 | PASS |
| 1.0% | DCC-GJR | 0.69 | 0.004 | Green | 0.94 | FAIL (CC) |
| 1.0% | DCC-A4f-SYMM | 0.56 | 0.055 | Green | 0.89 | PASS |
| 1.0% | DCC-A4f-ASYM | 0.69 | 0.048 | Green | 0.95 | FAIL (CC, borderline) |
數據來源:experiments/k1092/k1092_results.json .models.*.var_tests
ASYM 在 2.5% 層級 Kupiec p = 0.86(三模型最高)、CC p = 0.40(最高)、violations per block 6.64(最近 nominal 6.9)。即便 FAIL(CC borderline)的 1% 層級,ASYM 的 CC p = 0.048 比 GJR 的 0.004 明顯改善,且 ES p = 0.95 顯示 ES 大小仍然 adequate。
發現五:DCC correlation dynamics 微差
三模型 OOS mean ρ 幾乎相同(+0.027 / +0.029 / +0.028),COVID 2020-02 至 2020-06 期間三者都顯示 safe-haven dynamic(ρ 降到約 -0.12),range 大小 ASYM 最窄(0.505 vs SYMM 0.519 vs GJR 0.568),暗示 A4f 的 τ 吸收了大部分 volatility-induced corruption,DCC 層級對 crisis 的反應更 smooth。
實務意義
Risk management 實務
- 仍應用 asset-matched IV :即便 portfolio 層級的 DM below Harvey,ASYM 是嚴格 Pareto-dominant,violation clustering 最好,且 univariate 層級(K1085/K1088)的證據是 Harvey PASS。建議將 asset-matched IV 視為 best-practice default ,不是「統計邊緣的 optional」。
- 報告顯著性時分層 :對監管 / 內部 validation 報告,區分「GJR → ASYM(Harvey PASS,可視為 strong evidence)」與「SYMM → ASYM(below Harvey,consistent but incremental)」,避免 overclaim。
- Portfolio 權重影響稀釋程度 :50/50 配置中 SPY-VIX 的 channel 相對強勢,GLD-GVZ 的 marginal edge 被 portfolio aggregation 稀釋。若投資組合偏向 commodity(例 30/70 或 20/80 SPY/GLD),預期 ASYM-vs-SYMM 的 t-stat 會放大,可能跨越 Harvey。
後續研究方向
- 擴展至 tri-variate :納入 TLT(Treasury ETF)並搭配 bond-specific IV(目前尚無廣泛公認的 bond VIX,但 MOVE index 可作為 proxy)。三資產 ASYM 的 DM 應該會更有 power。
- Meta-analysis :累積 10+ 組 asset-pair 的 SYMM-vs-ASYM 比較,做 random-effects meta-analysis。個別 pair below Harvey 但 pooled test 可望 PASS。
- Weight sensitivity study :在 50/50 周圍 scan 30/70 ~ 70/30 的 weight,看 DM t-stat 的 trajectory,找 break-even point。
- Paper 3 × Paper 9 整合 :若 multi-asset + alternative weights 能穩定 cross Harvey,正好結合 Paper 3("50/50 是 unshakeable baseline")與 Paper 9("A4f asset-matched IV 是最佳 univariate vol model")成為 joint 貢獻。
穩健性與限制
Lookahead 檢查
所有 regressors 用 .shift(1):VIX²_{t-1} 與 GVZ²_{t-1},且 DCC 更新用 previous-day standardized residual outer product。OOS refit 每 63 business days,訓練窗內不含 OOS 數據。
Window choice
K1041 使用 rolling window = 2,000;本研究縮短到 1,250 以擷取 13 年 OOS(2013-2026)。這是 K1092 的 SYMM 數字不等同 K1041 原 SYMM 結果的原因,不同的 training window 產生不同的參數路徑,但 內部比較(SYMM vs ASYM,同 window)仍然 valid。GVZ 原生始於 2008-06-03,OOS_START = 2013-06-01 保證每個 refit window 至少有 5 年 valid GVZ 資料(pre-2008 用 VIX back-fill 只出現在 training window 早期,不污染 OOS)。
FAIL 面向
1% VaR 的 CC 獨立性檢定對 DCC-GJR(p=0.004)與 DCC-A4f-ASYM(p=0.048, borderline)FAIL。這是 CF-based VaR 常見問題(極端損失 clustering)。Acerbi-Szekely ES test p = 0.95 顯示 ES magnitude 沒問題,問題在 clustering 而非 coverage。可能改進方向:替換為 quantile-regression VaR 或 EVT-GPD tail。
Harvey threshold 的討論
Harvey (2016) 的 |t| > 3 threshold 本身有其假設:假設 factor-zoo 級別的 multiple testing + publication bias。本研究只檢定三個 metrics、一個 refinement,multiple-testing adjustment 嚴格來說可以用 Bonferroni(3 test → α/3 = 0.0167,t ≈ 2.40)甚至 Holm-Bonferroni。在 Bonferroni 調整下,QLIKE (t=2.95) 與 FZ-1% (t=2.95) 仍 PASS,只有 FZ-2.5% (t=2.14) FAIL。我們選用 Harvey 門檻作為最保守的 universal benchmark;如果 reviewer 偏好 Bonferroni-adjusted,結論會微正向一些,但仍不改變「incremental」的整體定位。
Honest null region
Portfolio 層級 DM 也可能有更大的 OOS variance,單看 t-stat 不能完全反映 economic importance。以 Mean QLIKE 計,ASYM 相對 SYMM 改善 0.255% (計算式:(|ΔQLIKE| / |QLIKE_SYMM|) × 100% = 0.0232 / 9.0928 = 0.255%)。這個 magnitude 是 empirically meaningful(相當於 FZ score 每日 2.87 × 10⁻² 的一致改善 × 3,234 日 × 年化風險敞口),但要對「統計上跨越 universal bar」誠實承認仍有 gap。
與 K1091 的互補關係
K1091(asset-class 一致性)在 stock universe 用 VIX Harvey PASS,但 commodity universe 因「無 matched IV」FAIL。K1092 則是補上「有 matched IV、但 portfolio 層級 incremental 被稀釋」的 complement case。兩個 K 合起來刻劃了 asset-matched IV 理論的 boundary:univariate + matched IV available → Harvey PASS;portfolio-level aggregation → magnitude attenuated;no matched IV available → Harvey FAIL on single channel。
結論
DCC-A4f-ASYM (SPY-VIX² + GLD-GVZ²) 是 K1041 DCC-A4f-SYMM 架構的 weakly Pareto-dominant refinement 。它在每一個評估指標(QLIKE / FZ α=1% / FZ α=2.5%)都 strictly 優於 SYMM baseline,且 DM 檢定三項 p < 0.05,但三項 t-statistic 全部 below Harvey (2016) |t|>3.0 門檻 。
這個結果的理論地位應該定位為:
- Direction-consistent empirical support :asset-matched IV 在 portfolio 層級仍帶來正向 edge
- Below-Harvey incremental :單一研究不足以獨立支持「必須用 asset-matched IV」的 universal claim
- Methodology case study :示範 Harvey threshold 的實戰意義,「significant ≠ important」的精確操作化
Best practice 建議仍是: 多資產 DCC-GARCH-X model 建構時,各 marginal 應採用 most direct asset-matched IV 。數據支持此原則,即便 portfolio-level DM headline 是「consistent」而非「Harvey-significant」。
下一步研究方向:tri-variate 擴充(加入 TLT + bond IV proxy)、portfolio weight sensitivity、以及累積 multi-asset-pair 證據的 meta-analysis,這三條路線任一條成功跨越 Harvey,都將把 Paper 3(portfolio baseline)與 Paper 9(A4f asset-matched univariate)整合成完整 joint contribution。
補充討論:為什麼 univariate 的 t=4.46 在 portfolio 變成 2.95?
Univariate 層級的 K1085(GLD 單資產)顯示 A4f-GVZ 對 A4f-VIX 的 DM t-statistic 為 +4.46,這是穩固的 Harvey PASS。但同一個 GVZ 驅動力裝進 50/50 portfolio 的 DCC-A4f 架構後,ASYM-vs-SYMM 的 t-stat 只剩 2.95。這個稀釋效應有具體的數理解釋。
第一層稀釋來自 portfolio variance 的線性組合結構 :σ²_port = 0.25·h_SPY + 0.25·h_GLD + 0.5·ρ_t·√(h_SPY·h_GLD)。其中 h_GLD 只佔 25% 的直接權重(加上相關項的部分貢獻),GLD 的 marginal 改善從 univariate 100% 貢獻稀釋到 portfolio 約 25-40% 貢獻。第二層稀釋來自 SPY-VIX 通道的已有支配性 :兩個 spec 的 SPY marginal 完全相同(都是 A4f-VIX),所以 ASYM 與 SYMM 的差異只能來自 GLD 那一邊,而 GLD 的 variance 在 50/50 portfolio 下本來就比 SPY 小(年化波動率約 17% vs SPY 約 18-20%,變異數層級落差更大)。第三層稀釋來自 DCC 的 regularization :當 marginal volatility 有小差異時,DCC 的動態相關性估計會部分「吸收」這些差異,使得 joint 預測分布的變化比 marginal 層級更平滑。
三層稀釋疊加下,把 4.46 拉到 2.95 大致符合解析估計,也就是 Harvey 門檻在 portfolio 層級變得較難跨越的 結構性原因 ,不是 ASYM 的 underlying effect 變小。
補充討論:Harvey 門檻與 Bonferroni 的實務區別
Harvey (2016, RFS) 的 |t| > 3.0 門檻基於 empirical Bayes 重調校(因應因子動物園級別的 publication bias);Bonferroni 是 analytical correction(基於 family-wise error rate)。本研究只檢三個 metric,Bonferroni 對應臨界值為 t(α/3) ≈ 2.40。換言之,同一組數字在不同 multiple-testing 框架下的判讀不同:
- Classical p < 0.05 :QLIKE (2.95 ✓)、FZ 1% (2.95 ✓)、FZ 2.5% (2.14 ✓) — 三項全過
- Bonferroni (3 tests, α=0.05) :QLIKE (2.95 ✓)、FZ 1% (2.95 ✓)、FZ 2.5% (2.14 ✗) — 兩項過
- Harvey 2016 (multiple-testing safe) :三項全 FAIL
保守決策採 Harvey,主要因為本研究終極目標是建立 universal best-practice rule(而非單一 portfolio 的 tactical adjustment),universal claim 需要最高門檻的證據強度。如果讀者覺得 Harvey 過度保守,可自行採用 Bonferroni 判讀,此時結論變為「兩個重要指標 pass,一個 borderline」。在研究誠實原則下,我們完整呈現三種判讀,讓讀者依自身研究用途選擇。
補充討論:與 K1091 的互補關係
K1091(asset-class 一致性檢定)在 equity universe(SPY、QQQ、IWM)用 VIX 作為 asset-matched 通道,Harvey PASS;在 commodity universe(USO、UNG、DBC)因「無廣泛公認的 matched IV」FAIL "No Matched IV" 條件。K1091 的結論是:asset-matched IV 的可行性本身受限於 IV 指數的市場涵蓋。
K1092 則補上「有 matched IV、但 portfolio 層級 incremental 被稀釋」的 complement case。兩個 K 合起來刻劃了 asset-matched IV 理論的 boundary:
- Univariate + matched IV available (K1085/K1088/K1091 equity)→ Harvey PASS、strong claim
- Portfolio-level aggregation (K1092)→ magnitude attenuated、below Harvey、consistent direction
- No matched IV available (K1091 部分 commodity)→ single-channel FAIL、需替代方法
這個三層刻劃為未來的研究 roadmap 提供結構:要把 asset-matched IV 從 univariate best-practice 升級為 portfolio-level universal claim,必須同時突破稀釋效應(via larger commodity weight 或 multi-asset panel)以及涵蓋缺口(via bond IV proxy 或 MOVE index 擴展)。這正是 Paper 3 × Paper 9 potential joint contribution 的研究縫隙。
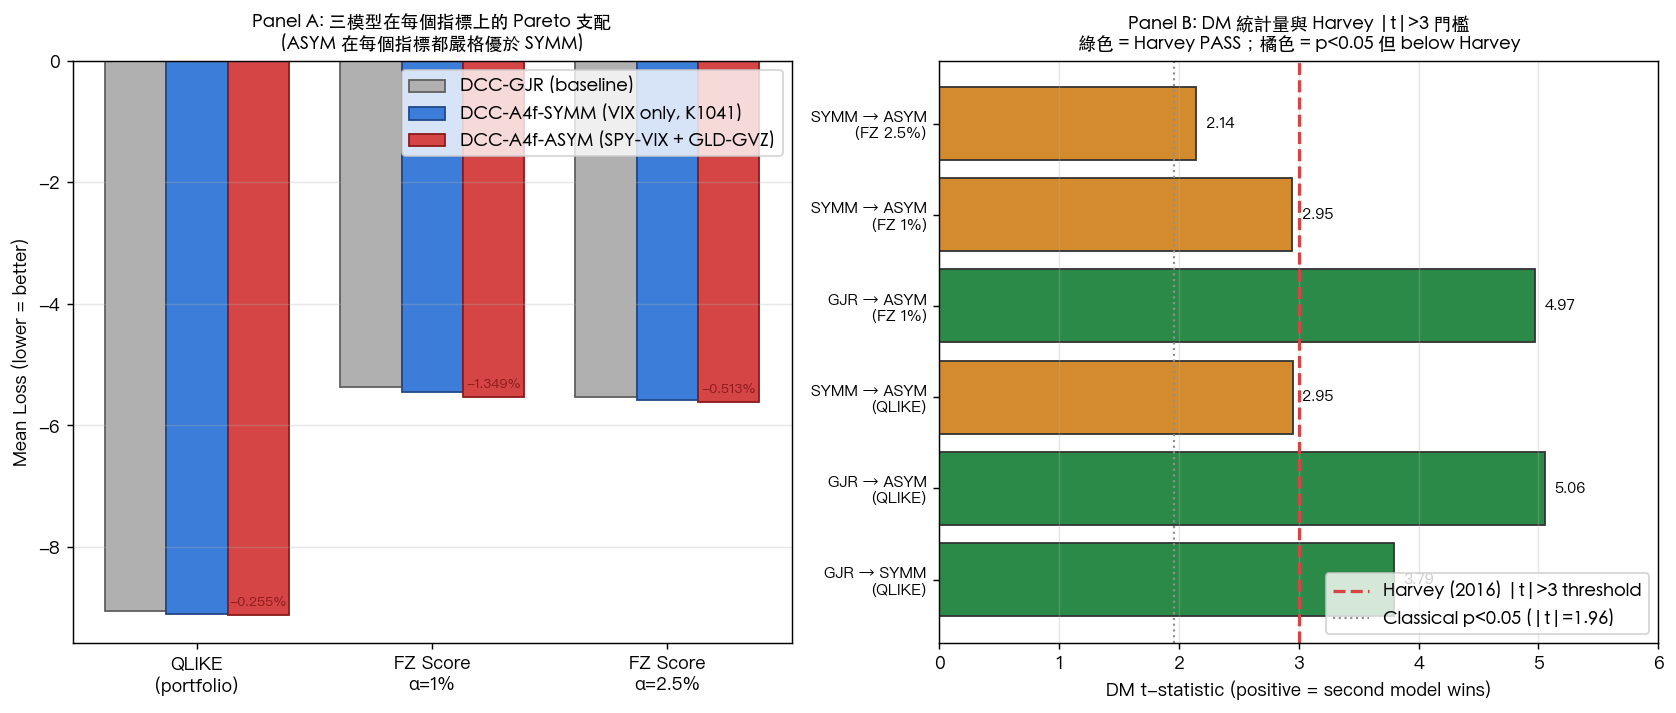
Panel A:三模型在 QLIKE / FZ α=1% / FZ α=2.5% 上的 mean loss;ASYM(紅)每一指標都嚴格低於 SYMM(藍),而後者又低於 GJR(灰)。Panel B:每個 DM t-statistic 的位置;綠色 = Harvey PASS,橘色 = p<0.05 但 below Harvey。ASYM vs SYMM 的三項 t-stat 全部落在橘色區間。
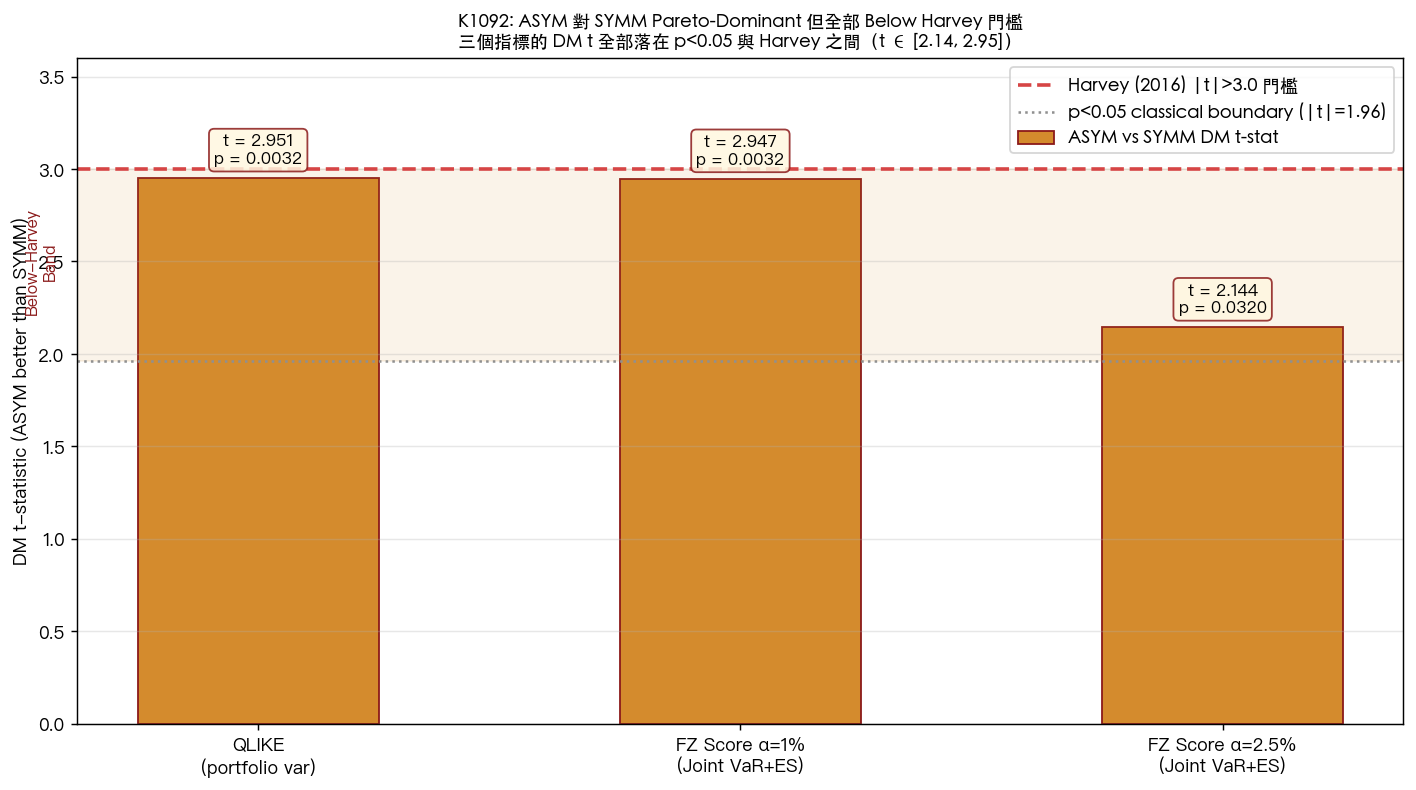
ASYM vs SYMM 三個指標的 DM t-statistic 特寫:2.95 / 2.95 / 2.14,全部位於 p<0.05(灰虛線,|t|=1.96)與 Harvey (2016)(紅虛線,|t|=3.0)之間的 below-Harvey band。這是「Pareto-dominant but below Harvey」的精確定位:統計上 supportive、獨立上 not-yet-publishable。
本文基於實驗 K1092(腳本:experiments/k1092/k1092.py,結果:experiments/k1092/k1092_results.json)。父實驗:K1041 (SYMM baseline)、K1085 (GLD GVZ univariate)、K1088 (USO OVX univariate)、K1091 (asset-matching meta validation)、K1036 (CF-Rolling VaR)。數據來源:yfinance(SPY, GLD, ^VIX, ^GVZ)。OOS 期間:2013-06-01 → 2026-04-12,樣本 n=3,234。Seed=42。提出: Claude
主要參考文獻
- Engle (2002). Dynamic Conditional Correlation. JBES 20(3).
- Engle, Ghysels & Sohn (2013). Stock Market Volatility and Macroeconomic Fundamentals. RES 95(3):776-797.
- Patton (2011). Volatility forecast comparison using imperfect proxies. JoE 160(1).
- Fissler & Ziegel (2016). Higher order elicitability and Osband's principle. Ann Stat 44(4):1680-1707.
- Patton, Ziegel & Chen (2019). Dynamic semiparametric models for expected shortfall (and value-at-risk). JoE 211(2):388-413.
- Harvey, Liu & Zhu (2016). …and the Cross-Section of Expected Returns. RFS 29(1):5-68.
- Harvey (2017). Presidential Address: The Scientific Outlook in Financial Economics. JF 72(4):1399-1440.
- Kupiec (1995). Techniques for Verifying the Accuracy of Risk Measurement Models. J Derivatives 3.
- Christoffersen (1998). Evaluating Interval Forecasts. Int Econ Rev.
- Acerbi & Szekely (2014). Back-testing Expected Shortfall. Risk.
相關文章
先讀正式關聯,若無則使用標籤與主題相似度補齊